Page 149 - Continental Reinsurance 2022 Annual Report
P. 149

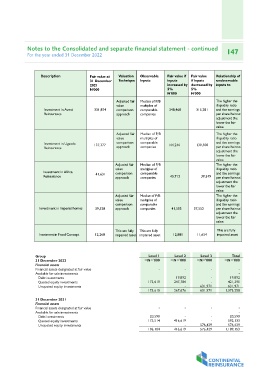
Notes to the Consolidated and separate financial statement - continued                                          147

For the year ended 31 December 2022

 Description                  Fair value at         Valuation Observable           Fair value if  Fair value    Relationship of
                              31 December           Technique Inputs               inputs         if inputs     unobservable
   Investment in Aveni        2021                                                 increased by   decreased by  inputs to
   Reinsurance                N'000                                                5%             5%
                                                                                   N'000          N'000
   Investment in Uganda
   Reinsurance                             331,874  Adjusted fair  Median of P/B   348,468        315,281       The higher the
                                                    value          multiples of                                 illiquidity ratio
   Investment in Africa                             comparison     comparable                                   and the earnings
   Reinsurance                                      approach       companies                                    per share haircut
                                                                                                                adjustment the
Investment in Imperial homes                                                                                    lower the fair
                                                                                                                value.
Ivestment in Food Concept
                                           137,377  Adjusted fair  Median of P/B   144,246          130,508     The higher the
                                                    value          multiples of     43,712              39,549  illiquidity ratio
                                                    comparison     comparable        41,505                     and the earnings
                                                    approach       companies                      37,552        per share haircut
                                                                                                                adjustment the
                                           41,631   Adjusted fair  Median of P/B                                lower the fair
                                                    value          multiples of                                 value.
                                                    comparison     comparable
                                                    approach       companies                                    The higher the
                                                                                                                illiquidity ratio
                                           39,528   Adjusted fair  Median of P/B                                and the earnings
                                                    value          multiples of                                 per share haircut
                                                    comparison     comparable                                   adjustment the
                                                    approach       companies                                    lower the fair
                                                                                                                value.

                                                                                                                The higher the
                                                                                                                illiquidity ratio
                                                                                                                and the earnings
                                                                                                                per share haircut
                                                                                                                adjustment the
                                                                                                                lower the fair
                                                                                                                value.

                                           12,268   This are fully This are fully  12,881         11,654        This are fully
                                                    impaired asset impaired asset                               impaired asset

Group                                                                 Level 1         Level 2        Level 3          Total
31 December 2022                                                   =N='000         =N='000        =N='000       =N='000
Financial assets
Financial assets designated at fair value                                     -               -              -             -
Available for sale investments                                                                                             -
                                                                      173,610          19,892                -      19,892
  Debt investments                                                    173,610         247,784                -     421,395
  Quoted equity investments                                                                          631,971       631,971
  Unquoted equity investments                                                                 -      631,971    1,073,258
                                                                                      267,676
31 December 2021
Financial assets                                                           -               -              -                -
Financial assets designated at fair value                                                                                  -
Available for sale investments                                      20,590                 -              -        20,590
                                                                   175,514         416,619                -       592,133
  Debt investments                                                                                576,429         576,429
  Quoted equity investments                                        196,104                 -      576,429       1,189,153
  Unquoted equity investments                                                      416,619
   144   145   146   147   148   149   150   151   152   153   154