
Page 147 - Continental Reinsurance 2022 Annual Report
P. 147
Notes to the Consolidated and separate financial statement - continued 145
For the year ended 31 December 2022
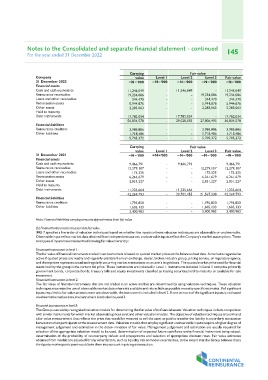
Carrying Fair value
value
Company Level 1 Level 2 Level 3 Fair value
31 December 2022 =N='000 =N='000 =N='000
Financial assets =N='000 =N='000
Cash and cash equivalents 11,246,049 - 11,246,049
Reinsurance receivables 19,234,086 - 11,246,049 - 19,234,086
Loans and other receivables - - 19,234,086
Retrocession assets 344,470 - - 344,470
Other assets 5,944,876 - - 344,470 5,944,876
Held to maturity 2,283,063 - 5,944,876 2,283,063
Debt instruments - 2,283,063
17,782,034 17,782,034
Financial liabilities 56,834,578 - 17,782,034 - 56,834,578
Reinsurance creditors - 29,028,083 27,806,495
Other liabilities 3,986,886 - 3,986,886
1,718,486 - 3,986,886 1,718,486
5,705,372 - 1,718,486 5,705,372
- 5,705,372
Carrying Fair value
value
Level 1 Level 2 Level 3 Fair value
=N='000 =N='000 =N='000
31 December 2021 =N='000 =N='000
Financial assets 9,466,791 - 9,466,791
Cash and cash equivalents 12,279,107 - 9,466,791 - 12,279,107
Reinsurance receivables - - 12,279,107
Loans and other receivables 175,325 - - 175,325
Retrocession assets 6,261,679 - - 175,325 6,261,679
Other assets 2,851,227 - 6,261,679 2,851,227
Held to maturity - 2,851,227
Debt instruments 11,235,664 11,235,664
42,269,793 - 11,235,664 - 42,269,793
Financial liabilities - 20,702,455 21,567,338
Reinsurance creditors 1,795,850 - 1,795,850
Other liabilities 1,605,133 - 1,795,850 1,605,133
3,400,983 - 1,605,133 3,400,983
- 3,400,983
Note: Financial liabilities carrying amounts approximates their fair value
(b) Financial instruments measured at fair value
IFRS 7 species a hierarchy of valuation techniques based on whether the inputs to those valuation techniques are observable or unobservable.
Observable input reect market data obtained from independent sources; unobservable inputs reect the Company's market assumptions. These
two types of inputs have created the following fair value hierarchy:
Financiual instrument in level 1:
The fair value of nancial instruments traded in active markets is based on quoted market prices at the balance sheet date. A market is regarded as
active if quoted prices are readily and regularly available from an exchange, dealer, broker, industry group, pricing service, or regulatory agency,
and those prices represent actual and regularly occurring market transactions on an arm's length basis. The quoted market price used for nancial
assets held by the group is the current bid price. These instruments are included in Level 1. Instruments included in Level 1 comprise primarily
government bonds, corporate bonds, treasury bills and equity investments classied as trading securities,held to maturity or available for sale
investment.
Financiual instrument in level 2:
The fair value of nancial instruments that are not traded in an active market are determined by using valuation techniques. These valuation
techniques maximise the use of observable market data where itis available and rely as little as possible on entity specic estimates. If all signicant
inputs required to fair value an instrument are observable, the instrument is included in level 2. If one or more of the signicant inputs is not based
on observable market data, the instrument is included in Level 3.
Financial instruments in level 3:
The Group uses widely recognised valuation models for determining the fair value of its nancial assets. Valuation techniques include comparison
with similar instruments for which market observable prices exist and other valuation models. The objective of valuation techniques is to arrive at
a fair value measurement that reects the price that would be received to sell the asset or paid to transfer the liability in an orderly transaction
between market participants at the measurement date. Valuation models that employ signicant unobservable inputs require a higher degree of
management judgement and estimation in the deter- mination of fair value. Management judgement and estimation are usually required for
selection of the appropriate valuation model to be used, determination of expected future cash ows onthe nancial instrument being valued,
determination of the probability of counterparty default and prepayments and selection of appropriate discount rates. Fair value estimates
obtained from models are adjusted for any other factors, such as liquidity risk or model uncertainties, to the extent that the Group believes that a
third party market participant would take them into account in pricing a transaction.