
Page 153 - Continental Reinsurance 2022 Annual Report
P. 153
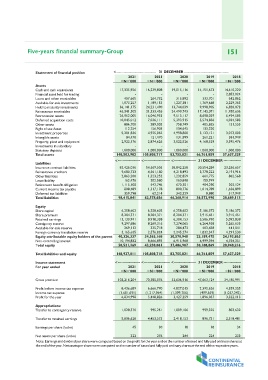
Five-years financial summary-Group 151
Statement of nancial position <-------------------------------- 31 DECEMBER ------------------------------------
Assets 2021 2021 2020 2019 2018
Cash and cash equivalents =N='000 =N='000 =N='000 =N='000 =N='000
Financial asset held for trading
Loans and other receivables 17,335,926 16,239,808 19,015,116 14,151,673 14,610,220
Available-for-sale investments - - - - 2,853,024
Held to maturity investments 642,862
Reinsurance receivables 407,665 264,732 315,892 333,701 2,229,365
Retrocession assets 1,073,257 1,189,153 1,227,381 1,769,668 6,820,073
Deferred acquisition costs 36,141,175 24,231,490 13,744,039 9,998,905
Other assets 46,341,505 31,333,426 24,499,743 17,143,071 11,950,636
Right of use Asset 26,952,005 16,046,933 9,513,117 8,698,039 6,494,583
Investment properties 10,045,012 7,036,111 5,393,915 5,574,856 4,034,583
Intangible assets 151,555
Property, plant and equipment 886,700 389,003 758,749 405,855 -
Investments in subsidiary 112,254 156,903 134,645 133,220 3,073,003
Statutory deposits 5,201,836 4,925,062 4,998,800 3,123,121 381,949
Total assets 121,470 131,899 261,221 3,395,476
84,470 2,874,626 3,022,526 4,168,529 -
Liabilities 2,922,176 1,000,000
Insurance contract liabilities - - -
Reinsurance creditors - 1,000,000 1,000,000 1,000,000 57,637,329
Other liabilities 1,000,000 105,808,717 83,755,821 66,761,859
Lease liability 148,503,982
Retirement benet obligation
Current income tax payable <------------------ <--------------------- <------------------ 31 DECEMBER --------------
Deferred tax liabilities
Total liabilities 83,426,036 54,569,505 38,842,258 30,554,284 23,256,657
9,680,733 4,561,180 4,218,493 3,778,222 2,191,916
2,863,200 1,323,252 1,232,859 661,775 862,568
162,476 202,580 160,898 150,749 -
1,115,108 542,746 670,301 404,290 203,124
808,489 1,317,178 800,776 1,014,789 1,656,899
359,798 62,214 343,329 8,880 517,949
98,415,841 62,578,656 46,268,914 36,572,990 28,689,113
Equity 6,258,602 6,258,602 6,258,602 5,186,372 5,186,372
Share capital 8,204,371 8,204,371 8,204,371 3,915,451 3,915,451
Share premium 13,130,941 8,918,338 6,304,153 5,586,910 5,093,838
Retained earnings 9,297,686 8,269,316 7,274,065 6,264,958 5,265,633
Contigency reserve
Available-for-sale reserve 269,112 335,718 284,473 403,438 441,041
Foreign currency translation reserve 3,165,625 2,576,824 2,245,274 1,832,347 4,291,530
Equity attributable equity holders of the parent 40,326,337 34,563,168 30,570,940 23,189,475 24,193,865
Non-controlling interest 10,194,832 8,666,893 6,915,968 6,999,394 4,754,351
Total equity 50,521,169 43,230,061 37,486,907 30,188,869 28,948,216
Total liabilities and equity 148,937,011 105,808,718 83,755,821 66,761,859 57,637,329
Income statement <------------------ <--------------------- <------------------ 31 DECEMBER --------------
For year ended
2021 2021 2020 2019 2018
=N='000 =N='000 =N='000 =N='000 =N='000
Gross premium 103,216,204 70,385,076 53,636,916 47,663,124 34,185,991
Prot before income tax expense 8,436,689 6,666,790 4,827,015 2,395,626 4,359,355
Income tax expense (1,601,691) (1,217,964) (1,399,756) (499,569) (1,037,242)
Prot for the year 1,896,057
6,834,998 5,448,826 3,427,259 3,322,113
Appropriations: 1,028,370 995,251 1,009,106 999,325 803,632
Transfer to contingency reserve
Transfer to retained earnings 5,806,628 4,453,575 2,418,153 896,731 2,518,481
Earnings per share (kobo) 45 30 18 18 34
Net assets per share (kobo) 322 276 244 224 233
Note: Earnings and dividend per share were computed based on the prot for the year and on the number of issued and fully paid ordinary shares at
the end of the year. Net assets per share were computed on the number of issued and fully paid ordinary shares at the end of the respective years.