
Page 145 - Continental Reinsurance 2022 Annual Report
P. 145
Notes to the Consolidated and separate financial statement - continued 143
For the year ended 31 December 2022
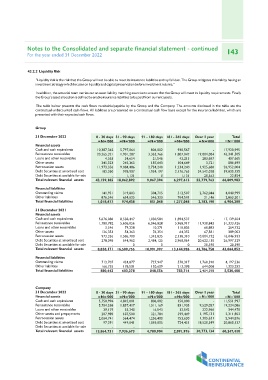
43.2.2 Liquidity Risk
"Liquidity risk is the risk that the Group will not be able to meet its insurance liabilities as they fall due. The Group mitigates this risk by having an
investment strategy which focuses on liquidity and capital preservation before investment returns."
In addition, the actuarial team carries out an asset liability matching exercise to ensure that the Group will meet its liquidity requirements. Finally
the Group’s asset allocation is dened to enable insurance liabilities to be paid from current assets.
The table below presents the cash ows receivable/payable by the Group and the Company. The amounts disclosed in the table are the
contractual undiscounted cash ows. All liabilities are presented on a contractual cash ow basis except for the insurance liabilities, which are
presented with their expected cash ows.
Group 0 - 30 days 31 - 90 days 91 - 180 days 181 - 365 days Over 1 year Total
=N='000 =N='000 =N='000
31 December 2022 =N='000 =N='000 =N='000
17,920,995
Financial assets 10,387,362 5,797,064 806,002 930,567 - 46,341,505
Cash and cash equivalents 20,265,321 1,901,287 3,363,766 1,807,047 19,004,084
Reinsurance receivables 407,665
Loans and other receivables 4,563 54,654 21,546 43,215 283,687 886,699
Other assets 345,323 245,363 187,643 104,649 3,721 26,952,004
Retrocession assets 11,973,356 9,084,486 2,734,240 1,234,240 39,835,155
Debt Securities at amortised cost 183,260 978,907 1,954,197 2,176,763 1,925,680
Debt Securities at available for sale 34,542,028 22,824
Total relevant nancial assets - 1,131 0 1,131 66,809,983
43,159,185 18,062,892 9,067,394 6,297,613 20,563
Financial liabilities 55,779,763
Outstanding claims
Other liabilities 141,931 319,803 304,715 512,507 2,762,044 4,040,999
Total nancial liabilities 876,546 654,635 546,333 764,541 21,146 2,863,201
1,018,477 974,438 851,048 1,277,048 6,904,200
31 December 2021 2,783,190
Financial assets
Cash and cash equivalents 5,676,086 8,538,447 1,030,584 1,894,537 - 17,139,654
Reinsurance receivables 1,780,782 5,606,056 6,046,828 5,968,917 11,930,843 31,333,426
Loans and other receivables
Other assets 3,546 79,228 10,271 110,805 60,883 264,732
Retrocession assets 126,353 54,363 76,354 64,352 67,581 389,003
Debt Securities at amortised cost 973,356 1,586,700 1,343,835 10,004,732 16,046,933
Debt Securities at available for sale 278,048 644,962 2,484,125 2,138,310 20,622,130 26,997,329
Total relevant nancial assets 2,968,064 20,590
- 0 0 42,706,758 20,590
Financial liabilities 8,838,171 16,509,755 10,991,997 0 43,064,852
Outstanding claims 13,144,986
Other liabilities
Total nancial liabilities 713,707 424,877 727,947 570,317 1,760,390 4,197,236
166,735 178,501 120,609 213,398 644,008 1,323,252
880,442 603,378 848,556 783,714 5,520,488
2,404,398
Company 0 - 30 days 31 - 90 days 91 - 180 days 181 - 365 days Over 1 year Total
31 December 2022 =N='000 =N='000 =N='000 =N='000
Financial assets =N='000 =N='000 806,002 150,000 - 11,551,997
Cash and cash equivalents 1,311,169 831,905 9,529,057 19,234,086
Reinsurance receivables 5,750,994 4,845,001 16,543 32,542 222,966
Loans and other receivables 321,784 399,449 1,195,131 344,470
Other assets and prepayments 5,704,538 1,857,417 1,256,400 753,630 1,305,631 2,311,852
Retrocession assets 1,069,005 724,451 18,520,349 5,944,876
Debt Securities at amortised cost 39,179 33,240 - - - 20,860,137
Debt Securities at available for sale 4,780,904 2,891,976
Total relevant nancial assets 207,989 187,500 30,773,134 -
60,247,418
2,064,741 564,474
97,291 449,041
--
13,864,731 7,936,673