
Page 154 - Continental Reinsurance 2022 Annual Report
P. 154
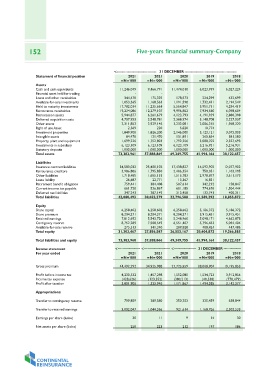
152 Five-years financial summary-Company
Statement of nancial position <-------------------------------- 31 DECEMBER ------------------------------------------
Assets 2021 2021 2020 2019 2018
Cash and cash equivalents
Financial asset held for trading =N='000 =N='000 =N='000 =N='000 =N='000
Loans and other receivables
Available-for-sale investments 11,246,049 9,466,791 11,474,010 6,023,919 6,027,224
Held to maturity investments - - - - -
Reinsurance receivables
Retrocession assets 344,470 175,325 178,573 224,299 432,699
Deferred acquisition costs 1,053,365 1,168,563 1,191,598 1,732,411 2,194,549
Other assets 17,782,034 11,235,664 5,564,847 3,951,711 4,294,419
Right of use Asset 19,234,086 12,279,107 9,996,802 7,934,560 6,098,604
Investment properties 5,944,877 6,261,679 4,123,793 4,191,959 2,880,398
Intangible assets 4,707,953 3,548,781 2,388,974 3,148,708 2,227,037
Property, plant and equipment 2,311,852 2,929,146 3,232,081 2,086,215 1,968,320
Investments in subsidiary
Statutory deposits 2,569 230 5,820 10,774 -
Total assets 1,849,900 1,826,200 2,146,000 3,123,121 3,073,003
Liabilities 84,470 121,470 131,891 260,854 381,580
Insurance contract liabilities 1,699,226 1,752,803 1,792,256 3,088,702 2,327,693
Reinsurance creditors 6,123,109 6,123,109 6,123,109 5,216,931 5,216,931
Other liabilities 1,000,000 1,000,000 1,000,000 1,000,000 1,000,000
Lease liability 73,383,961 57,888,869 49,349,755 41,994,164 38,122,457
Retirement benet obligation
Current income tax payable 34,580,032 25,400,102 17,438,827 16,592,902 12,077,902
Deferred tax liabilities 3,986,886 1,795,850 2,406,354 750,051 1,103,195
Total liabilities 1,718,485 1,605,133 1,515,783 3,611,173
26,687 22,771 13,367 2,978,877 -
Equity 759,441 384,408 507,614 16,831 158,847
Share capital 661,720 536,867 601,185 1,504,444
Share premium 347,243 287,149 313,458 342,212 400,311
Retained earnings 774,676
Contigency reserve 42,080,493 30,032,279 22,796,588 133,743 18,855,872
Available-for-sale reserve 21,589,292
Total equity
6,258,602 6,258,602 6,258,602 5,186,372 5,186,372
Total liabilities and equity 8,204,371 8,204,371 8,204,371 3,915,451 3,915,451
7,812,692 5,543,726 5,248,960 5,098,171 4,662,873
Income statement 8,752,289 7,508,549 6,551,407 5,796,453 5,054,404
For year ended
275,513 341,340 289,828 408,424 447,486
Gross premium 31,303,467 27,856,587 26,553,167 20,404,872 19,266,585
Prot before income tax 73,383,960 57,888,866 49,349,755 41,994,164 38,122,457
Income tax expense
Prot after taxation <------------------ <--------------------- <------------------ 31 DECEMBER --------------
Appropriations: 2021 2021 2020 2019 2018
Transfer to contingency reserve =N='000 =N='000 =N='000 =N='000 =N='000
Transfer to retained earnings 44,492,292 34,925,988 27,725,559 28,008,904 19,195,853
Earnings per share (kobo) 4,230,532 1,457,298 1,552,080 1,534,723 3,912,856
(428,626) (123,352) (380,213) (40,338) (770,479)
Net assets per share (kobo) 3,801,906 1,333,946 1,171,867 3,142,377
1,494,385
799,859 289,580 250,253 325,459 638,844
3,002,047 1,044,366 921,614 1,168,926 2,503,533
30 11 9 14 30
250 223 212 197 186