
Page 99 - Continental Reinsurance 2022 Annual Report
P. 99
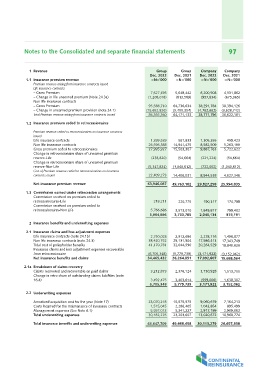
Notes to the Consolidated and separate financial statements                                                       97

    1 Revenue                                                                  Group         Group    Company      Company
                                                                          Dec. 2022     Dec. 2021    Dec. 2022    Dec. 2021
 1.1 Insurance premium revenue                                             =N='000       =N='000      =N='000      =N='000
       Premium revenue arising from insurance contracts issued
       Life insurance contracts                                              7,627,495    5,648,442  6,200,508    4,531,862
       – Gross Premium                                                     (1,208,018)    (813,589)  (957,834)    (675,065)
       – Change in life unearned premium (Note 24.3a)
       Non life insurance contracts                                         95,588,710  64,736,634   38,291,784   30,394,126
       – Gross Premium                                                    (15,652,826)  (5,400,354)  (4,762,662)  (3,628,742)
       – Change in unearned premium provision (note 24.1)                               64,171,133   38,771,796   30,622,181
       Total Premium revenue arising from insurance contracts issued        86,355,360

 1.2 Insurance premium ceded to retrocessionaires                          1,399,539        561,833  1,305,255      459,423
                                                                          26,596,388    14,941,475   8,582,509    5,263,199
       Premium revenue ceded to retrocessionaires on insurance contracts  27,995,927    15,503,307   9,887,763    5,722,622
       issued
       Life insurance contracts                                           (238,820)     (54,664)     (221,224)    (54,664)
       Non life insurance contracts
       Gross premium ceded to retrocessionaires                           (5,347,834) (1,040,612)    (722,002) (1,040,612)
       Change in retrocessionaire share of unearned premium
       reserve-Life                                                       22,409,273 14,408,031 8,944,538 4,627,346
       Change in retrocessionaire share of unearned premium
       reserve-Non Life                                                   63,946,087 49,763,102 29,827,258 25,994,835
       Cost of Premium revenue ceded to retrocessionaires on insurance
       contracts issued                                                      218,211       220,775      190,317   174,789

       Net insurance premium revenue                                      5,766,686     3,513,010    1,849,817    799,402
                                                                          5,984,896     3,733,785    2,040,134    974,191
 1.3 Commission earned under retrocession arrangements
       Commission received on premium ceded to                             2,750,028     2,912,686    2,278,116    1,496,877
       retrocessionaires-Life                                             38,420,752    29,131,904   17,986,413   17,343,749
       Commission received on premium ceded to                                                                    18,840,626
       retrocessionaires-Non Life                                         41,170,781    32,044,590   20,264,529

    2 Insurance benefits and underwriting expenses                        (6,705,348) (5,779,739) (3,171,922) (3,152,062)
                                                                          34,465,432 26,264,851 17,092,607 15,688,564
 2.1 Insurance claims and loss adjustment expenses
       Life insurance contracts (note 24.1b)                              3,212,873     2,376,124    3,730,928    1,513,755
       Non life insurance contracts (note 24.3)
       Total cost of policyholder benefits                                3,492,475     3,403,614     (559,006)   1,638,307
       Insurance claims and loss adjustment expenses recoverable          6,705,348     5,779,739    3,171,922    3,152,062
       from retrocessionaire
       Net insurance benefits and claims                                  23,070,218    15,575,975    9,060,619    7,164,213
                                                                           1,515,045     2,286,405    1,042,854       895,499
2.1a Breakdown of claims recovery                                          5,597,013     5,341,227    2,917,199
       Claims recovered and recoverable on paid claims                                               13,020,672    2,909,062
       Change in retro share of outstanding claims liabilities (note      30,182,276    23,203,607                10,968,774
       16.4)
                                                                          64,647,709 49,468,458 30,113,279 26,657,338
 2.2 Underwriting expenses

       Amortized acquisition cost for the year (Note 17)
       Costs incurred for the maintenance of insurance contracts
       Management expenses (See Note 6.1)
       Total underwriting expenses

       Total insurance benefits and underwriting expenses