
Page 98 - Continental Reinsurance 2022 Annual Report
P. 98
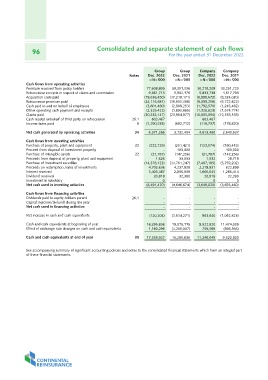
96  Consolidated and separate statement of cash flows

                                                    For the year ended 31 December 2022

                                                              Notes       Group       Group      Company          Company
                                                                     Dec. 2022   Dec. 2021      Dec. 2022        Dec. 2021
                                                                      =N='000     =N='000        =N='000          =N='000

Cash flows from operating activities                                 77,608,805 59,301,336 36,218,209 30,251,720
Premium received from policy holders
Retrocession receipts in respect of claims and commission            9,861,713   5,902,176      5,833,738 4,617,793
Acquisition costs paid
Retrocession premium paid                                            (19,636,450) (17,218,171) (8,898,672) (8,324,020)
Cash paid to and on behalf of employees
Other operating cash payment and receipts                            (24,116,681) (15,503,308) (9,099,258) (5,722,622)
Claims paid
Cash receipt onbehalf of third party on retrocession                 (3,601,480) (2,808,253) (1,792,570) (1,245,482)
Income taxes paid
                                                                     (2,325,422) (1,893,685) (1,326,623) (1,574,774)
Net cash generated by operating activities
                                                                     (30,232,147) (23,954,977) (16,805,094) (15,183,158)
Cash flows from investing activities
Purchase of property, plant and equipment                     26.1 603,467       - 603,467                       -
Proceed from disposal of investment property
Purchase of intangible assets                                 8 (1,790,538)      (692,712)      (119,737) (178,820)
Proceeds from disposal of property, plant and equipment
Purchase of investment securities                             34 6,371,266 3,132,404 4,613,460 2,640,637
Proceeds on redemption /sales of investments
Interest received                                             22 (222,126) (251,421)              (123,074)        (160,415)
Dividend received                                                                                             -      403,000
Investment in subsidary                                              - 403,000
Net cash used in investing activities                                                               (21,787)       (147,256)
                                                              22     (21,787)    (147,256)             1,532           28,719
Cash flows from financing activities
Dividends paid to equity holders parent                              1,626       33,033         (7,407,185)      (5,759,202)
Capital injection/(refund) during the year                                                        2,219,831          622,899
Net cash used in financing activities                                (14,378,123) (11,761,247)    1,660,045
                                                                                                      20,818       1,286,414
Net increase in cash and cash equivalents                            4,702,636   4,237,928                   0         32,380
                                                                                                                              0
Cash and cash equivalents at beginning of year                       3,405,487   2,806,909      (3,649,820)
Effect of exchange rate changes on cash and cash equivalents                                                     (3,693,460)
                                                                     20,818      32,380
Cash and cash equivalents at end of year
                                                                     0-

                                                                     (6,491,470) (4,646,674)

                                                              26.1 - - - -
                                                                                        - - --
                                                                                        - - --

                                                                     (120,204) (1,514,271)      963,640 (1,052,823)

                                                                     16,295,836  19,015,115     9,522,820 11,474,009
                                                                      1,160,296  (1,205,007)      759,589 (898,366)

                                                              35 17,335,927 16,295,836 11,246,049 9,522,820

See accompanying summary of significant accounting policies and notes to the consolidated financial statements which form an integral part
of these financial statements.